General Assembly of Maryland Department of Legislative Services Logo
Maryland General Assembly
Department of Legislative Services
  • General Assembly of Maryland
  • Executive Branch
  • Judicial Branch
  • Share on my Twitter
  • Share on my Facebook
  • View RSS feeds
  • Home
  • Policy Areas
  • Budget
  • Data
  • Publications
  • Employment
  • Library
  • Audits
  • About Us
  • Share on my Twitter
  • Share on my Facebook
  • General Assembly of Maryland
  • Executive Branch

Summary


This grid map shows, for the 2022 general election, the number of registered voters at the time of the election and the voter turnout for the election, both as a percentage of the voting age population, in order to be able to see both on the same scale (as a % of voting age population). At the time of the 2022 general election, 86% of the voting age population in the State was registered to vote, and 42% of the voting age population voted. Among the counties, the percentage of the voting age population that was registered to vote in a given county, at the time of the 2022 general election, varied from 69% to 98%, and the percentage of the voting age population that voted in each county varied from 32% to 58%. Please see the note below the grid map regarding the fact that voting age population includes individuals who are not eligible to register to vote or to vote (e.g., noncitizens and individuals in prison for a felony).

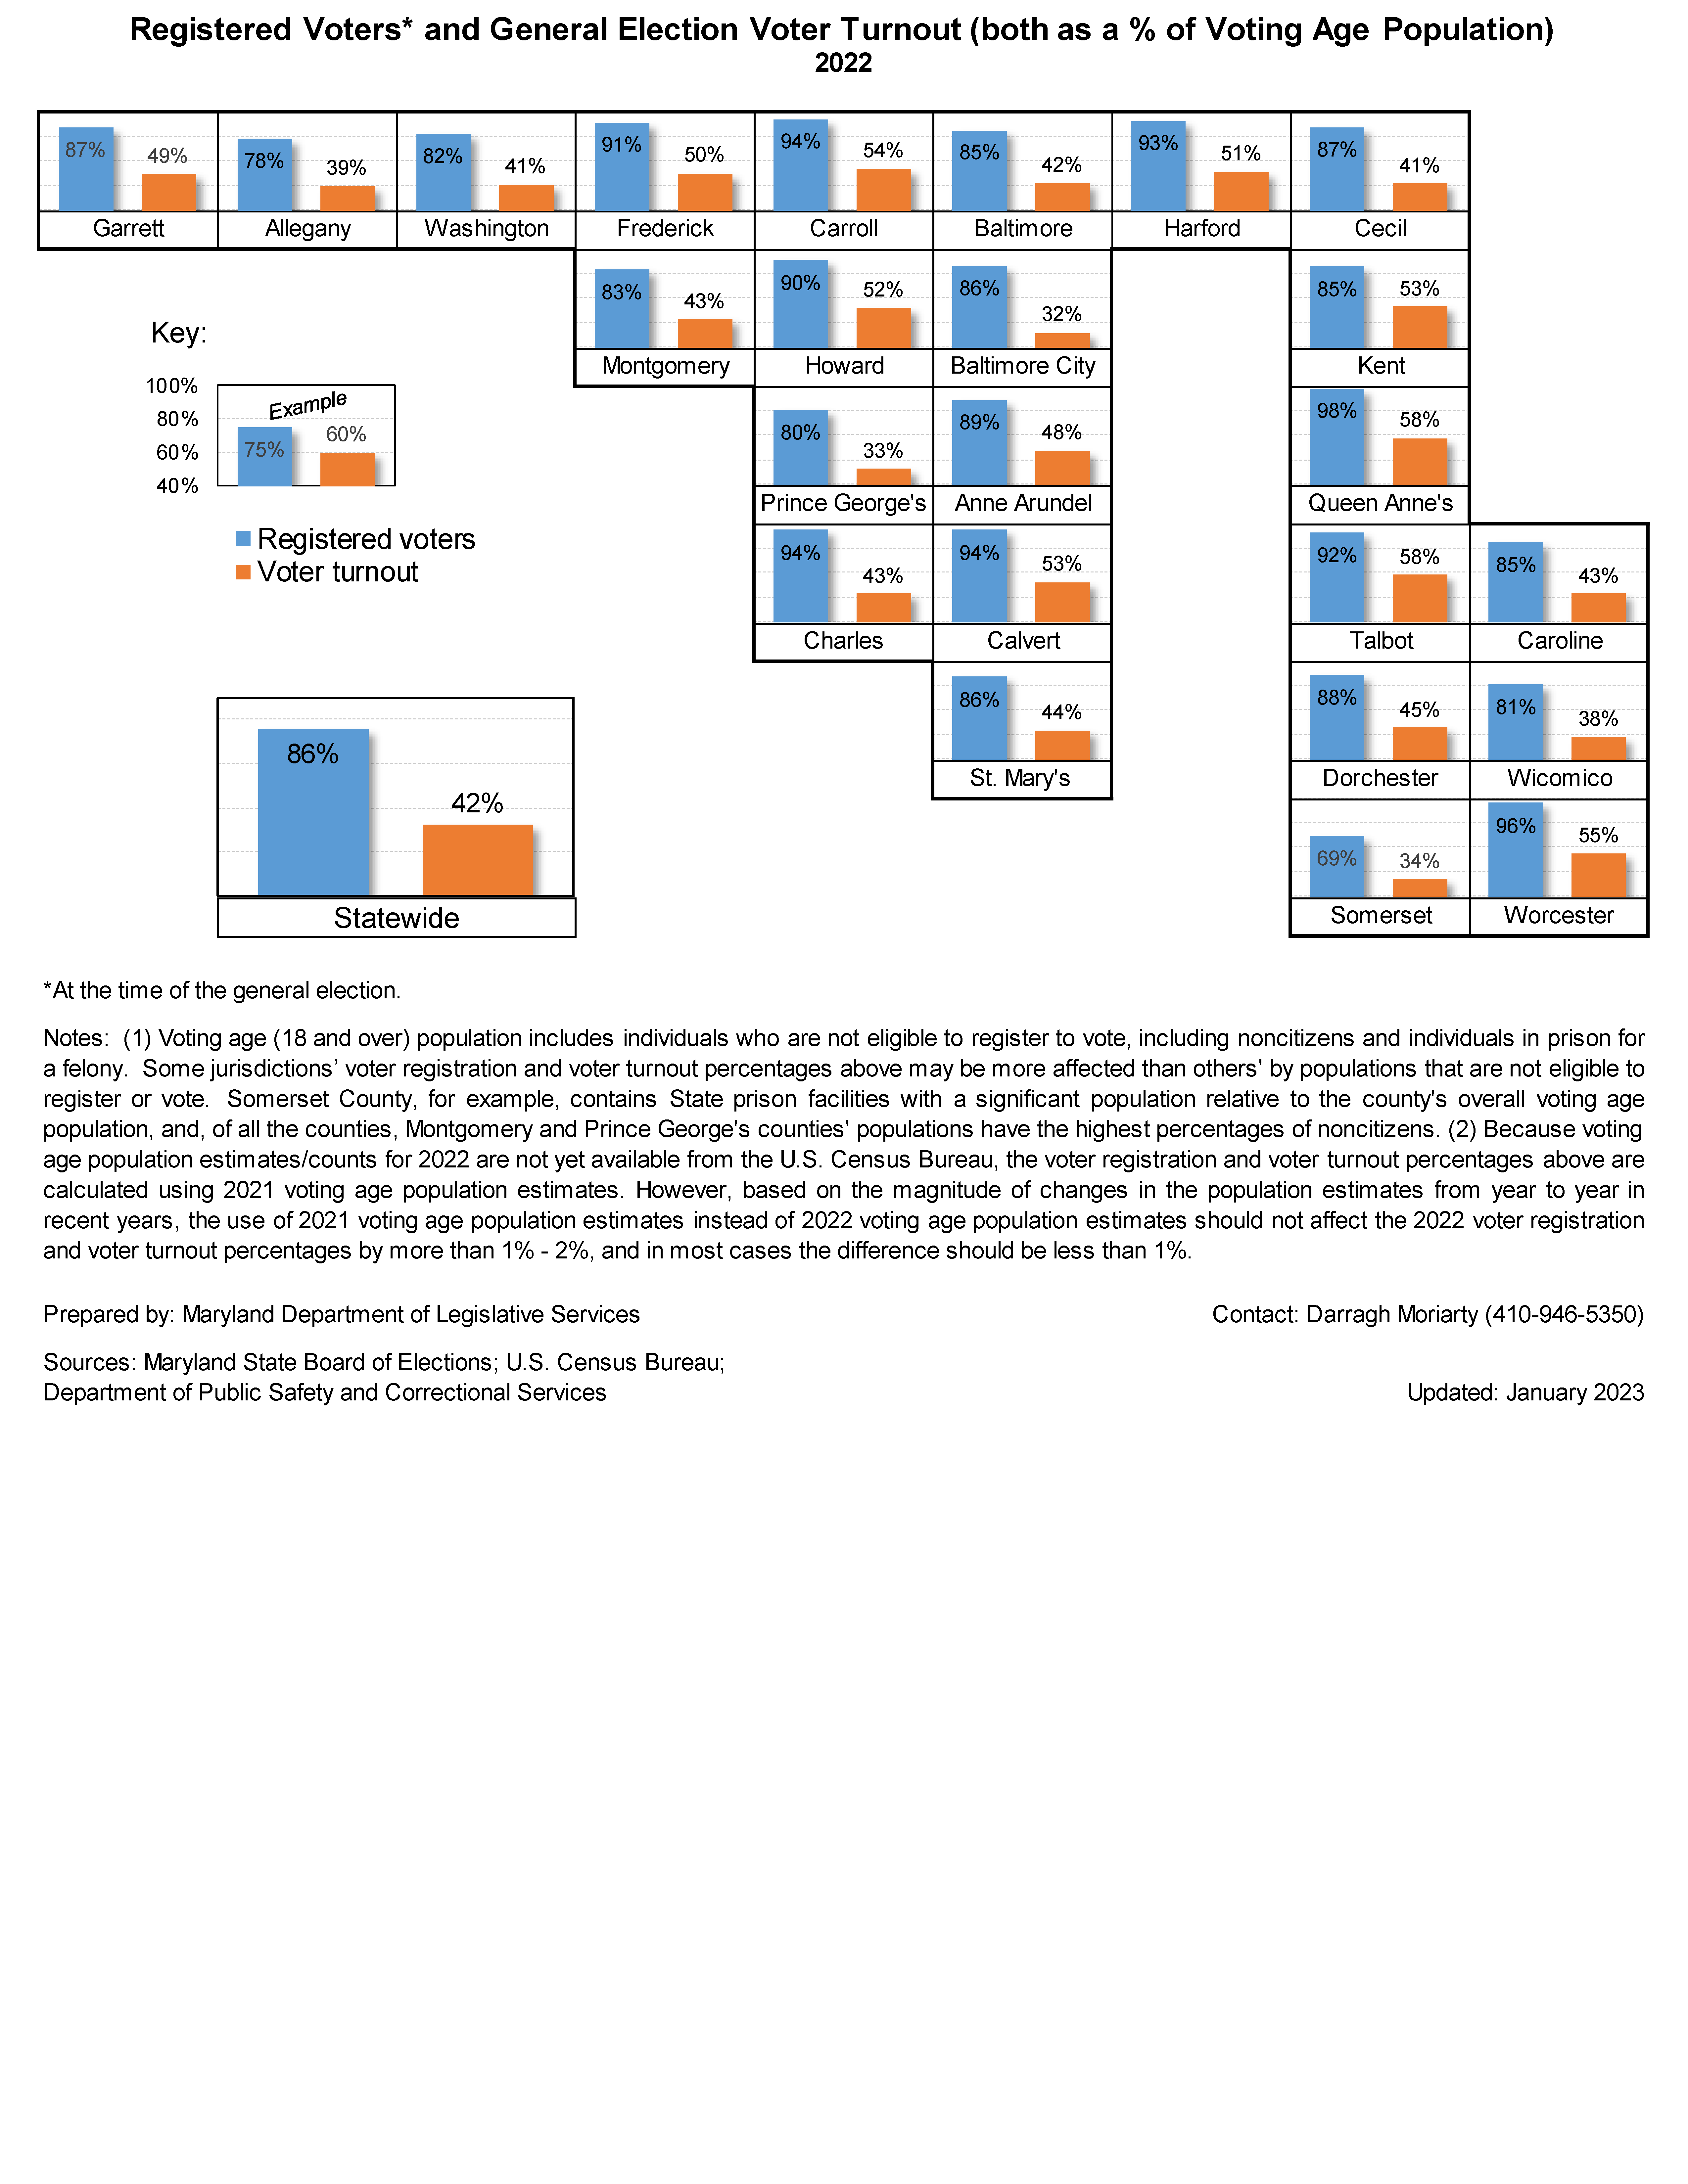
2022 Registered Voters and General Election Voter Turnout (Both as a % of Voting Age Population) – By County (Grid Map)

PDF (best for enlarging or printing the dashboard)

© 2026 - General Assembly of Maryland Department of Legislative Services
FAQ | Contact