General Assembly of Maryland Department of Legislative Services Logo
Maryland General Assembly
Department of Legislative Services
  • General Assembly of Maryland
  • Executive Branch
  • Judicial Branch
  • Share on my Twitter
  • Share on my Facebook
  • View RSS feeds
  • Home
  • Policy Areas
  • Budget
  • Data
  • Publications
  • Employment
  • Library
  • Audits
  • About Us
  • Share on my Twitter
  • Share on my Facebook
  • General Assembly of Maryland
  • Executive Branch

Summary

The percentage of the voter registration age (16 and over) population in the State that was registered to vote for the 2014 gubernatorial general election and 2016 presidential general election was 79% and 82%, respectively. For both the 2014 and 2016 general elections, voter registration levels for individual counties were generally in the range of 70% to 90%. The percentages reflect the whole voter registration age population of a jurisdiction and do not account for the ineligibility of a portion of the population to register to vote (primarily noncitizens and those in prison for a felony). 

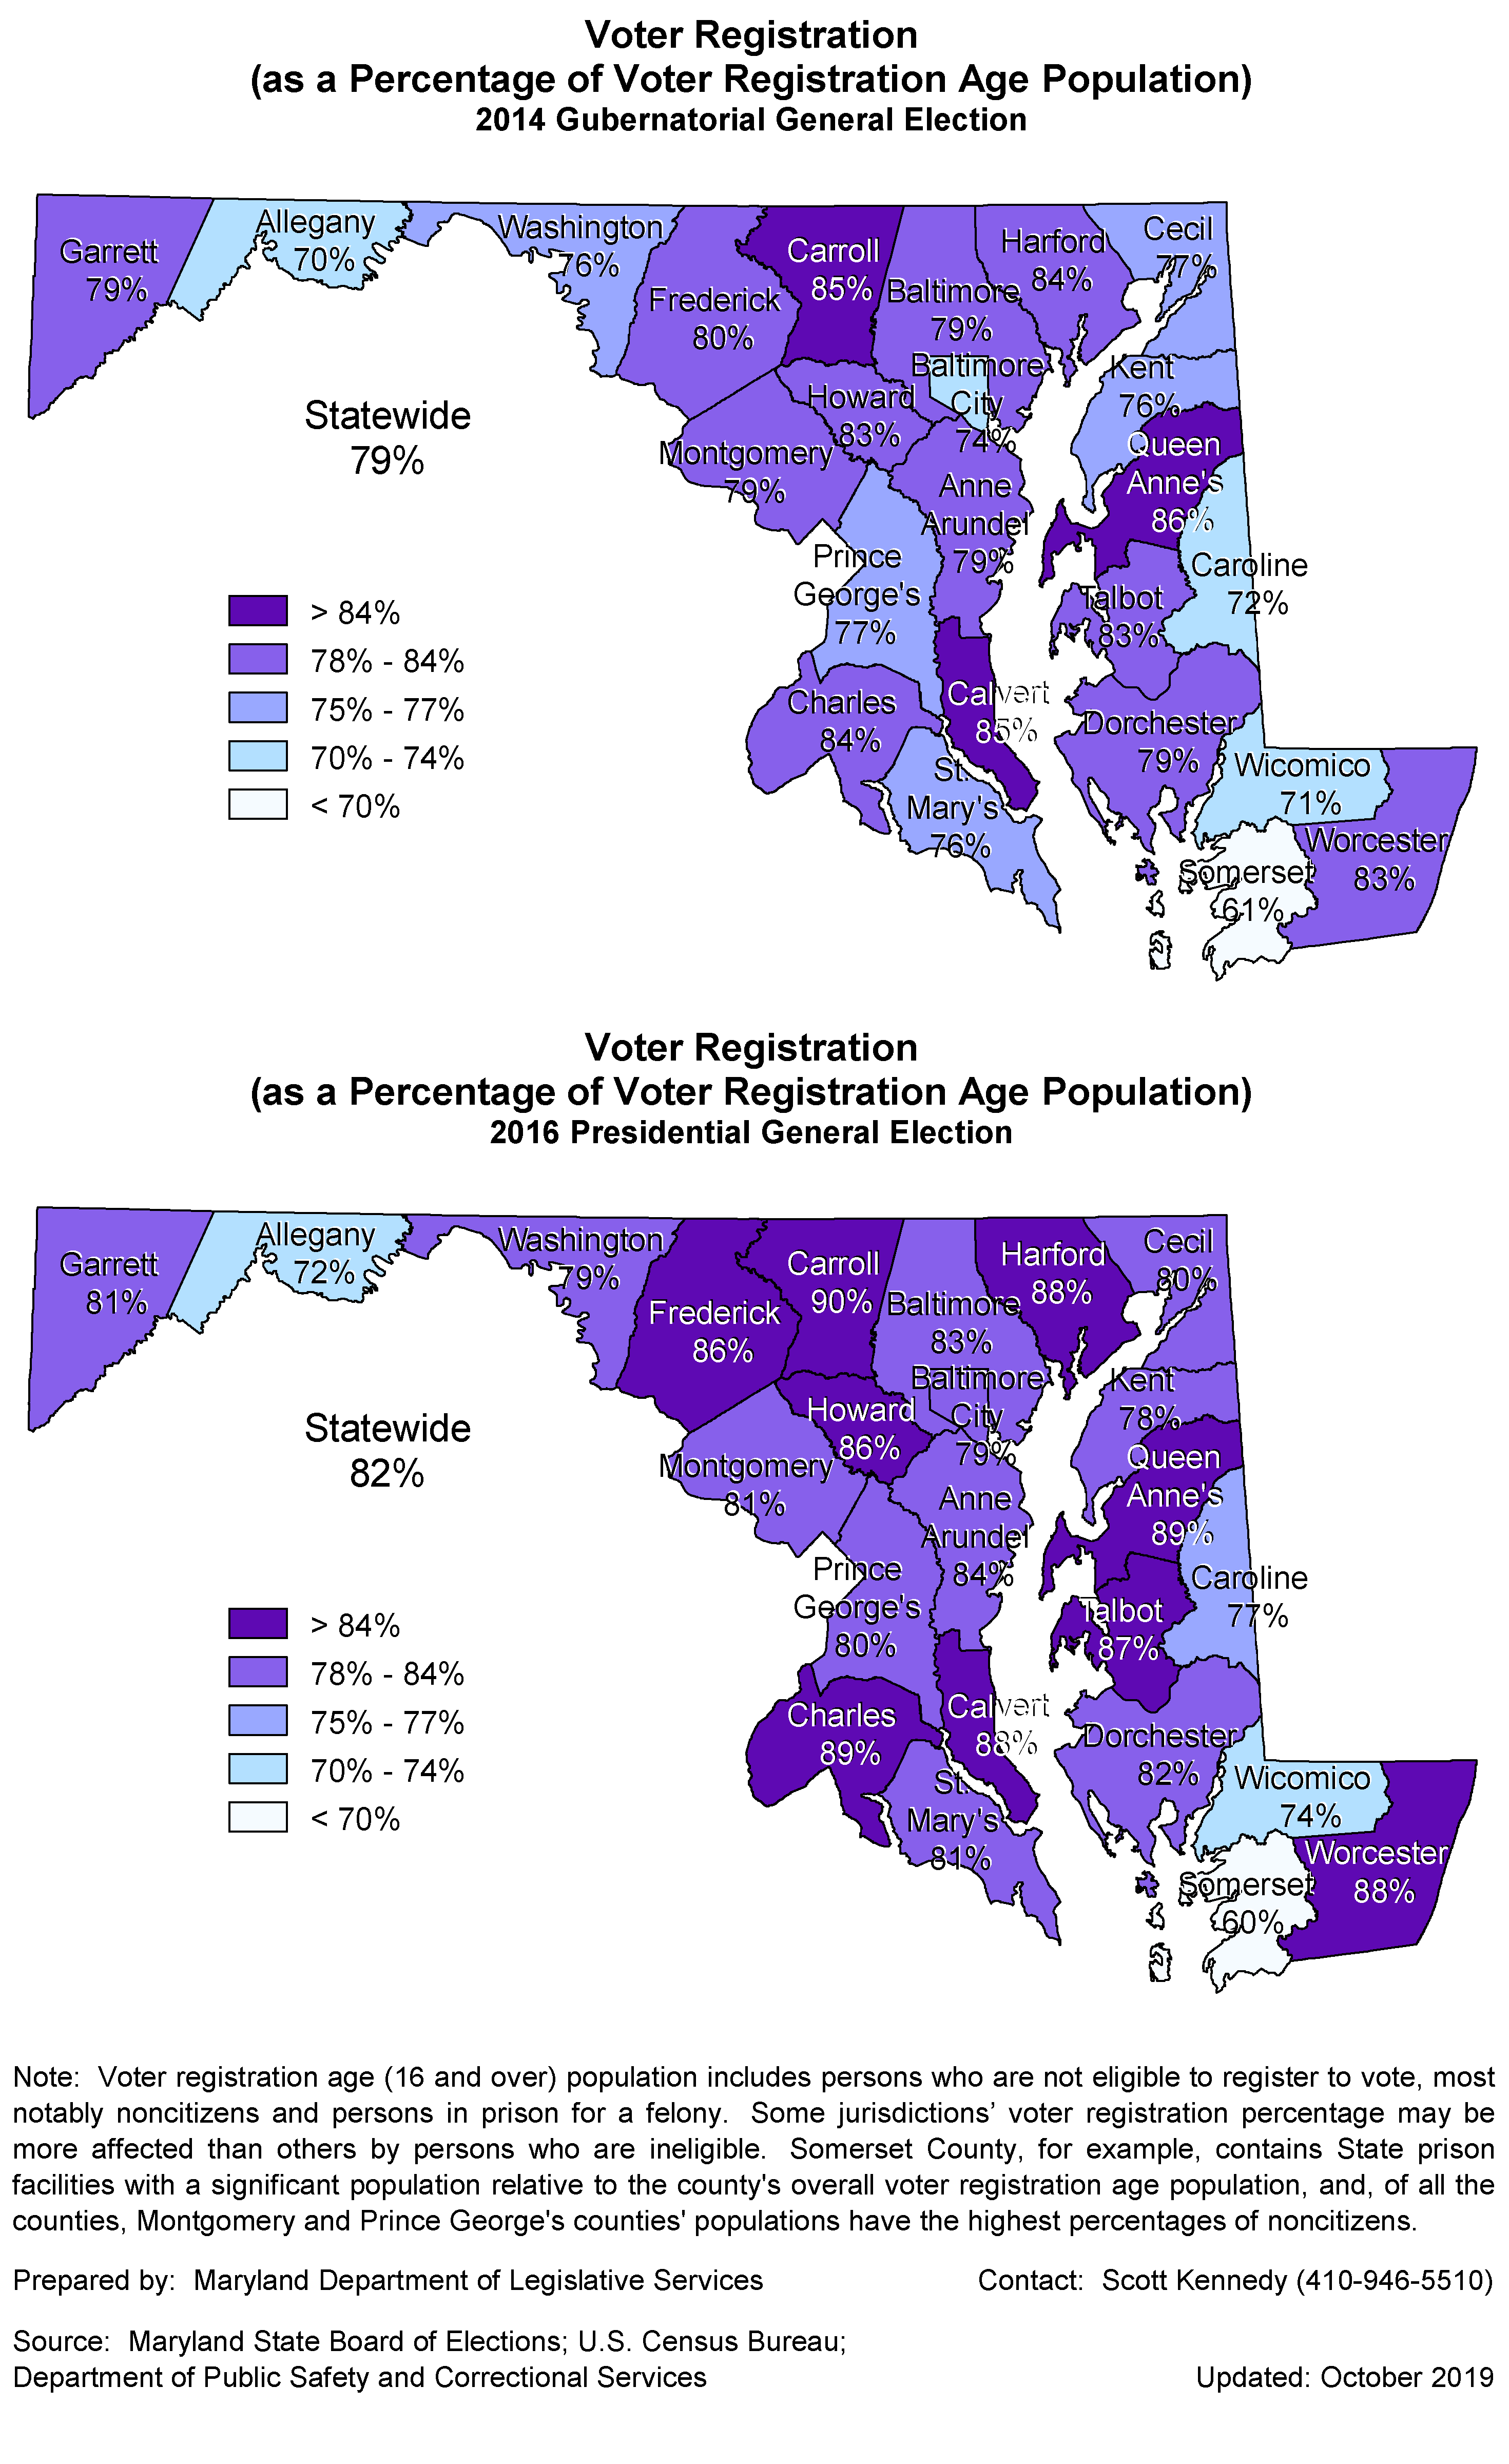
Voter Registration, by County:  Prior Elections (Maps)

PDF (best for enlarging or printing the dashboard)

© 2026 - General Assembly of Maryland Department of Legislative Services
FAQ | Contact